Project Description
Make sure you have read the exam description and that you are familiar with the rules concerning the use of Artificial Intelligence (generative AI) in teaching and exams at DTU
Project Groups
You will be working in the groups assigned from the beginning of the course
IMPORTANT: All groups members are responsible for all parts of the project!
Note, completing the project is considered your exam preparation
Project as a Collaborative effort
As per the course description at the DTU course base: Active participation in the group work and timely submission of project and code base are both indispensable prerequisites for exam participation.
This means, that each group member is expected to:
- Generally participate actively in the group project
- Take responsibility for solving assigned tasks within the project
- Write and review code and perform commit-/push-/pulls to the project GitHub repository
- Meet and discuss actively with the group members
- Spend 9-10h per week on the project for the full 3 week project period
Bio Data Science is a collaborative effort, which is reflected in the design of the project module of this course!
Expected time usage
As per the rules for the European Credit Transfer System (ECTS) points, 1 credit equals 28 hours. Therefore, for a 5-person group working for 3 weeks, the expected total project hours is ~150. Setup your collaborative project and this will be more than sufficient to create a full bio data science project. Note, for lab 13, you workload will be a ~10min. presentation therefore the hours for this lab is included.
Project Description
Aim
The aim with the Project module of the course is to allow you to independently work with the course elements, you have been exposed to during the first 9 weeks of teaching. Here, you will synthesise the entire bio data science cycle, thereby internalising the course elements. Moreover, you are to:
- Use the tools you have learned in the course and “design and execute a bio data science project focusing on collaborative coding and reproducibility, incl. independently using online resources to seek information about application and technical details of state-of-the-art data science tools”
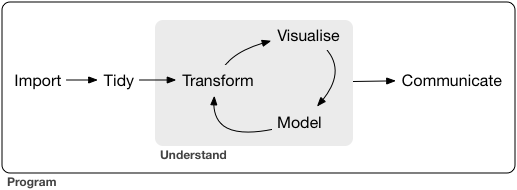
Recall the “Data Science Cycle”

Project Requirements
Location
The project must be placed on the course GitHub organisation and named e.g. group_03_project, replacing 03, with your group number.
GitHub README
- IMPORTANT: First header in the README has to be “Project Contributors” and then please state the student ids and matching GitHub usernames, so we know who-is-who
- Be sure to include a direct link to your presentation, e.g. the direct link to the lecture in lab 3 is:
https://raw.githack.com/r4bds/r4bds.github.io/main/lecture_lab03.html - Since we are not putting data on GitHub, use the README to supply information on data retrieval
Organisation
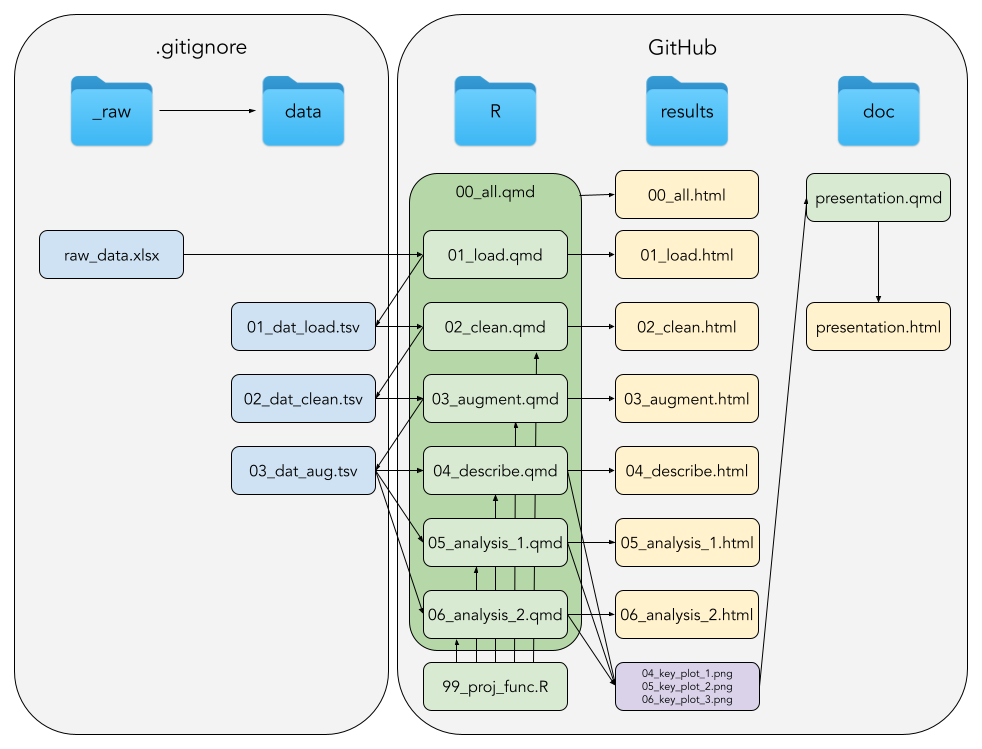
Your project must strictly adhere to the organisation illustrated below:

Where directories left-to-right, starting with data and corresponding files are:
data: Your data
_raw: Directory insidedata, containing your raw data file(s), which must never be editedraw_data.xlsx: This need not necessarily be an Excel-file, but should be seen as a placeholder for whichever raw data, your project is based on
01_dat_load.tsv: Your loaded data, e.g. combining multiple sheets from an excel file02_dat_clean.tsv: Your data cleaned per your specifications and in tidy format03_dat_aug.tsv: Your data with added variables, e.g. like computing a BMI
R: Your code
NB! Every .qmd-file MUST be end-to-end executable independent from environment variables create in other .qmd-files
01_load.qmd: Loads your data, e.g. combining multiple sheets from an excel file02_clean.qmd: Cleans your data per your specifications and converts to tidy format03_augment.qmd: Adds new variables, like e.g. computing a BMI04_describe.qmd: Descriptive statistics, how many in each group, etc.05_analysis_1.qmd: Here goes your first analysis06_analysis_2.qmd: Here goes your second analysis and so on99_proj_func.qmd: DRY: Don’t Repeat Yourself, repeated code goes into a function00_all.qmd: The master document, capable of running the entire project in one go
results: Your results
*.html: The output from your*.qmds in yourR-directorykey_plots.png: Whichever of all the nice plots you made, which should end up in your final presentation
doc: Your documents
presentation.qmd: Your final Quarto Presentation of your projectpresentation.html: Self-contained HTML5 presentation (just as the course slides)
Important: This entails, that the entire project as put on GitHub, can be cloned and then executed end-to-end. Since, we are not putting data on GitHub, if possible included programmatic retrieval of data and/or data instructions on how to easily retrieve the data, e.g. via login, in your GitHub repository README file
But How???
Yes, we are not putting the data on GitHub, so either include programmatic retrieval of the data or state in your GitHub README file, how you retrieved the data forming the base of the project.
Code
Your project must strictly adhere to the Course Code Styling Guide
Data
First and foremost, you must find a data set you can work with in the project!
It must be based on a bio data set
Start out as “dirty” i.e. a completely clean / tidy and analysis-ready data set will not allow you to demonstrate, that you have met the course learning objectives
It is advisable, that the data is of limited size, so you do not risk time waste due to long runtimes
Note, you should demonstrate ability to extract biological insights, but at the same time mind that the focus should be on demonstrating that you master the data science toolbox according to course aim and learning objectives
Remember, the process is the product!
Naturally, you cannot reuse the data we have worked with during the exercise labs
Presentation
A 10-slides-in-10-mins presentation, possibly followed by a few questions
Follow the IMRAD standard scientific structure:
- Introduction
- Materials and Methods
- Results (And)
- Discussion
With a technical focus, but minding to communicate which-ever biological insights you arrived at
Should not include all your code, but rather focus on the broader picture and include data summaries and visualisations
Created using
Quarto Presentation, just as the course slides areNOTE: This final presentation in HTML-format must be zipped and uploaded to DTU Learn before deadline, so we can check the GitHub version is identical
Project Supervision
As a point of reference, this project is part of the overall assessment and you will therefore have limited access to supervision
Think of the project, as a long take-home-assignment
I highly encourage the use of Piazza for questions, which will be monitored by the teaching team
Also, a rather comprehensive list of Project FAQ have been compiled, so be sure to check that out!
I recommend using your course Quarto documents for reference
Also, perhaps you can get input on the Posit Community Pages
If any aspects of the above is not clear, please reach out to the teaching team!